Simple Sparkline using SVG Path and D3.js
09 Aug 2011I’ve been playing with SVG visualization and the d3.js library (replacement to Protovis).
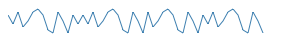
As a starting point this is a simple line chart used as a sparkline. The HTML and Javascript provide a boiler plate from which more complex visualizations and charts can be built.
Here are links to the code and working example:
http://bl.ocks.org/1133472 https://gist.github.com/1133472
To make the size more applicable to inline  use as a sparkline decrease the ranges:
`
var x = d3.scale.linear().domain([0, 10]).range([0, 20]);
var y = d3.scale.linear().domain([0, 10]).range([0, 10]);
`
use as a sparkline decrease the ranges:
`
var x = d3.scale.linear().domain([0, 10]).range([0, 20]);
var y = d3.scale.linear().domain([0, 10]).range([0, 10]);
`
UPDATE: I added another version that shows animations with transformations and transitions.