Animated Circle Using d3.js
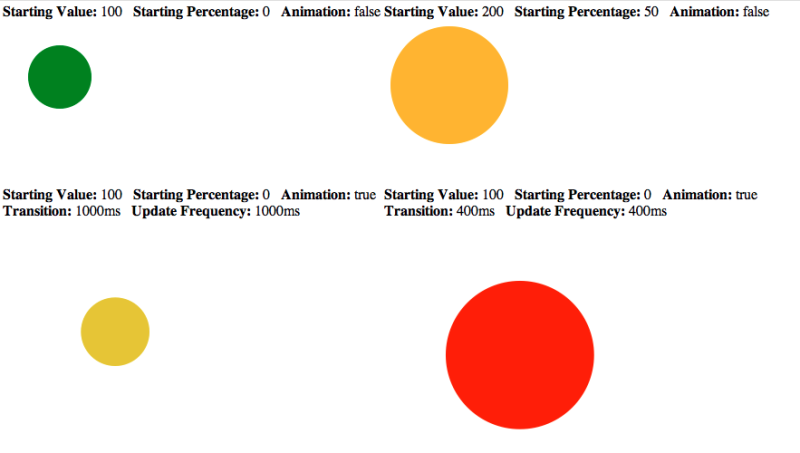
13 Dec 2011While working on visualizing data (application traffic) in realtime I used circles with size representing volume and color representing health.
Here are basic examples of circles with varying sizes and colors and animating them to dynamically change that I used as building blocks.
Here are links to the code and working example: